Challenge
Technology Used
- HTML & CSS
- Javascript
- Darksky API
- Google Places API
- Heroku
- Github
Solution
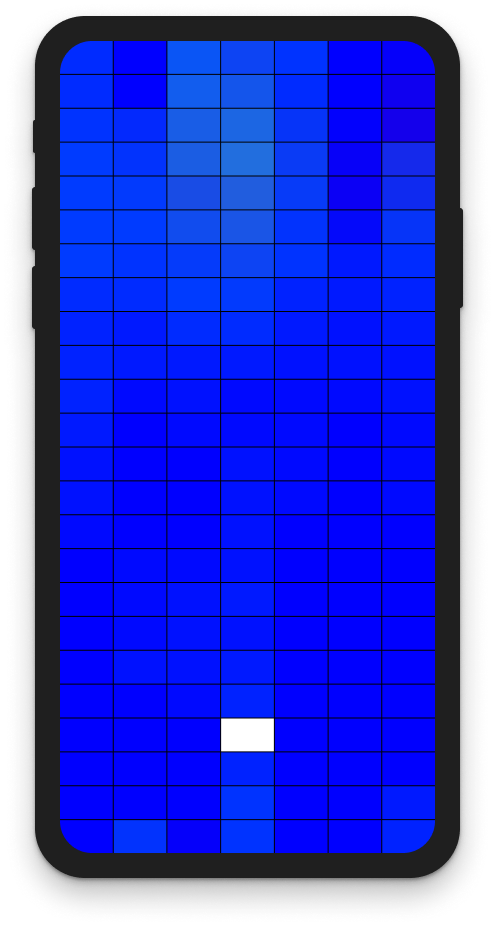
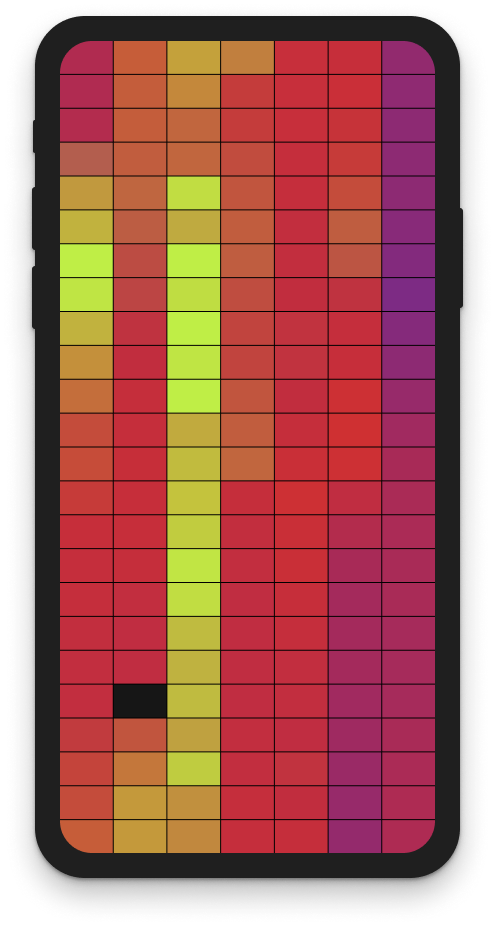
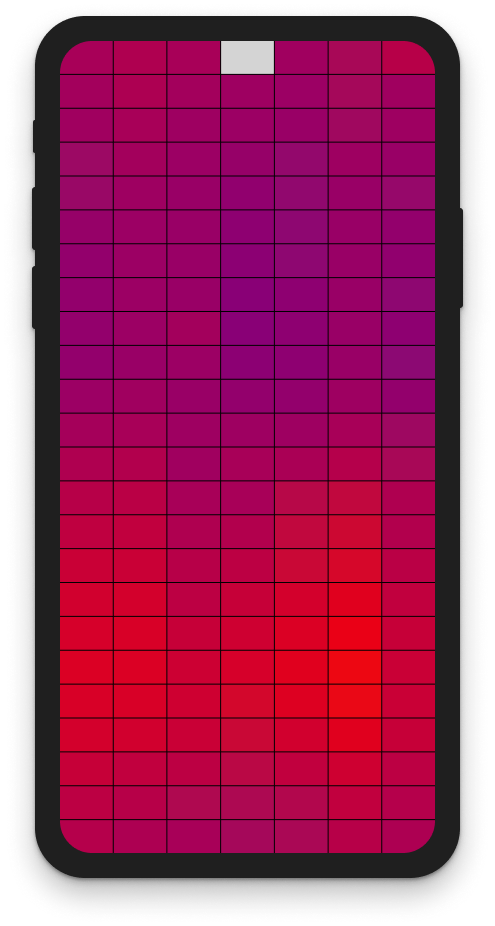
I designed a forecast resembling a weekly calendar with 7 days and 24 hours in each day. Each hour uses a single RGB background color to communicate both temperature and chance of precipitation.
More reddish means a higher temperature while more blue indicates a cooler one. The more green a color is, the higher the chance of precipitation. You can identify the current hour on the grid by the fading animation from black to white.
High-Level Code Logic
- User enters location
- Use Google Places API to determine X,Y coordinates
- Fetch data from DarkSky using X, Y coordinates and return extended hourly forecast for the next 168 hours (1 week)
- Create a 7 x 24 space grid (168 total spaces) within a GUI representing the time (in hours) and days
- Style the RGB background color on each space of the grid using a higher R (red) or B (blue) for temperature and G (green) for precipitation
- Capture the current weekday and time then cycle the grid until the current hour is in the appropriate spot on the grid, simulating a calendar view
- Give the current hour an animation
- Set timer to rerun application at the top of each hour to update data as long as the browser window is open
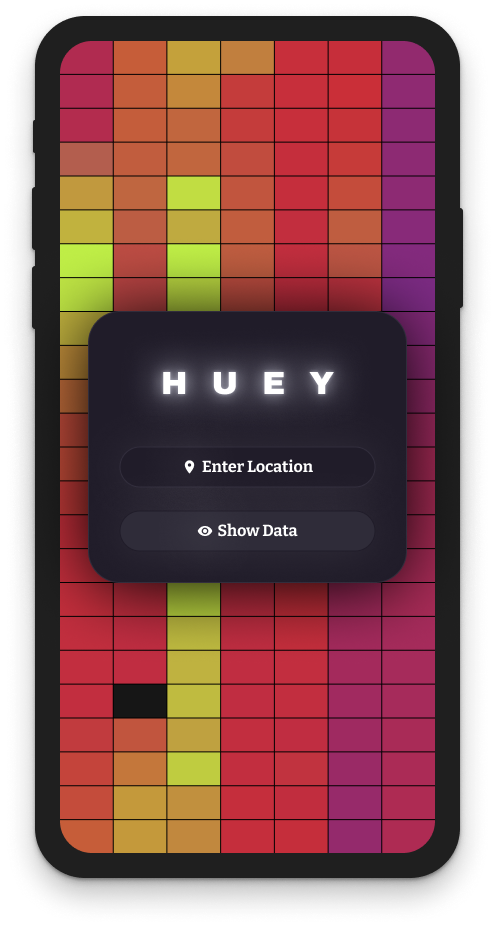
Homepage Design
A single location input and data toggle control are all that powers this experience.
Simple and beautiful, with a wealth of data to be interpreted at a glance. HUEY enables you to see trends in the weather around you.
Sample Weather Patterns
Mt. Everest 8pm on a Wednesday in March
Austin, Texas 7pm on a Monday in March
Death Valley 12am on a Wednesday in March